Profile your C++ code in real-time, get predictions of your next steps and observe live variable changes in your
Visual Studio IDE
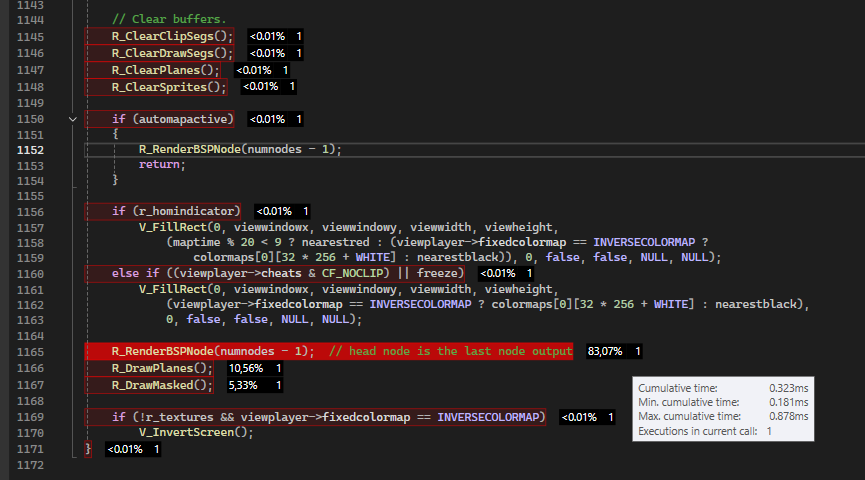
Get real-time feedback on performance
Profile your application based on what is currently happening and breakdown function performance line-by-line.
Navigate codebase right in Visual Studio without starting or stopping profiling sessions.
Activate the profiler mode in Visual Studio top menu Extensions, D0, Live Profiler.
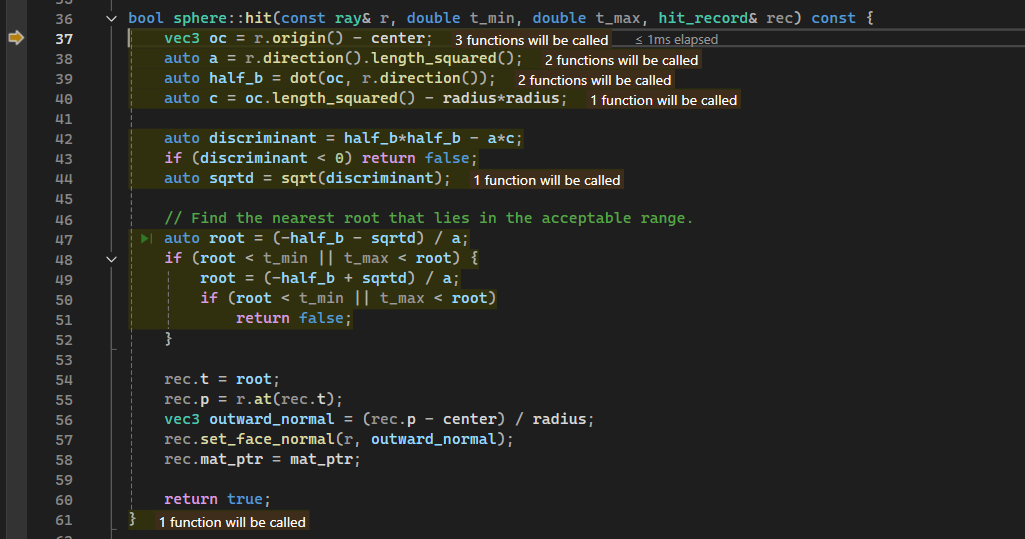
Know where you will be stepping next
Save debugging time by seeing what will be executed ahead of time. D0 will emulate code from your current cursor and show where you will be stepping next. This makes it much easier to step through code without worrying about accidentally overstepping or skipping, since you can already see the result before you get there.
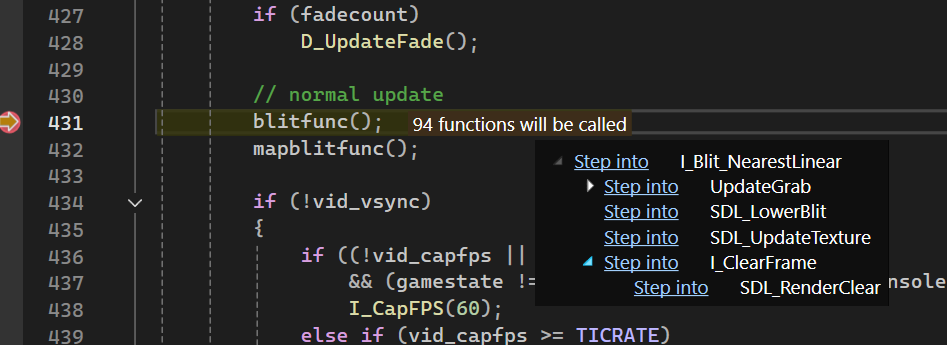
Step into specific invocation
Not sure where you will be stepping into? D0 will show you the entire call tree of the function you are about to step into, ahead of time. You can then step into any specific invocation in the call tree without navigating through the entire call stack and getting lost.
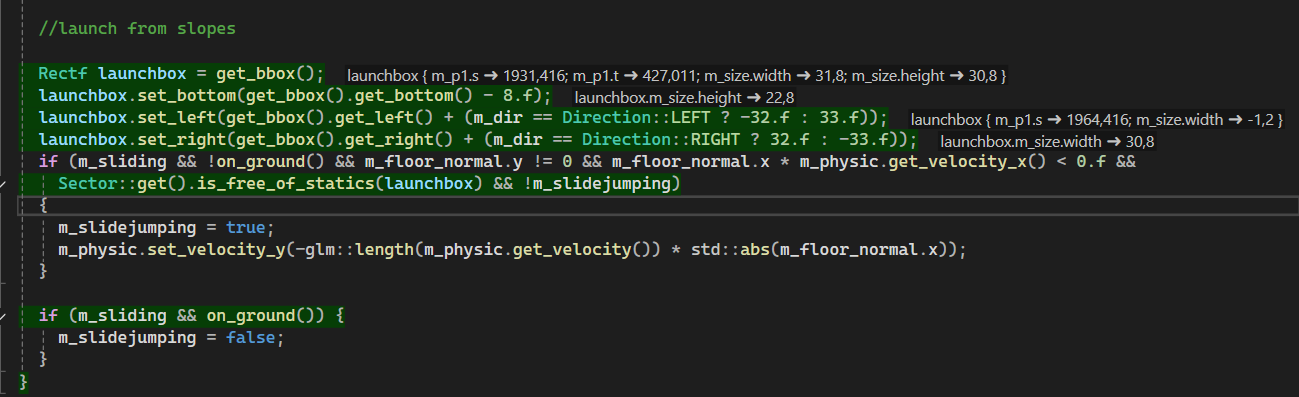
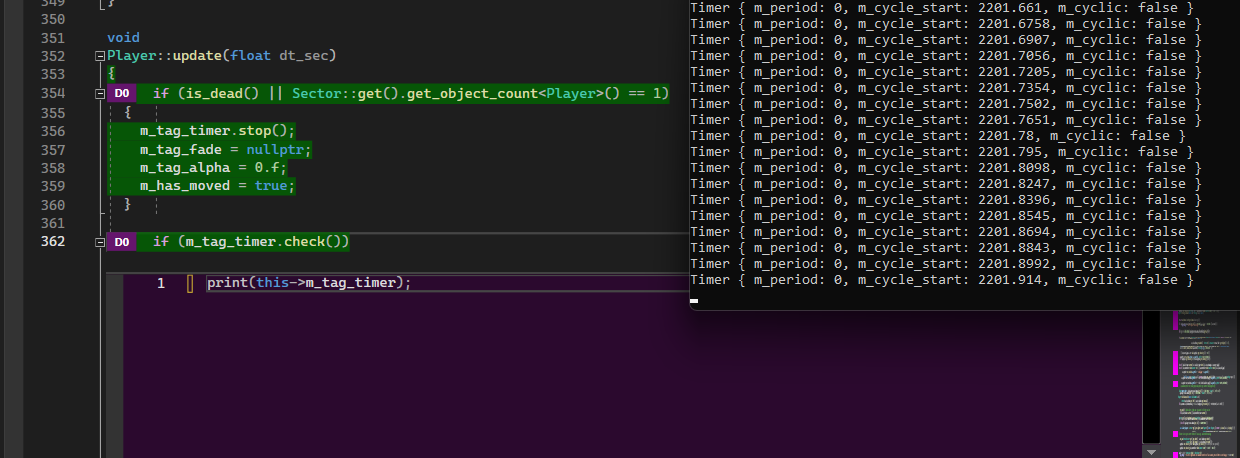
Track variable changes in real-time
Place the cursor in any function and start tracking variable changes in real-time. Supports complex objects and STL containers.
Print anything, anywhere
Insert print statements in your code without recompiling and print any complex object (right click on the line, choose Insert D0 snippet)
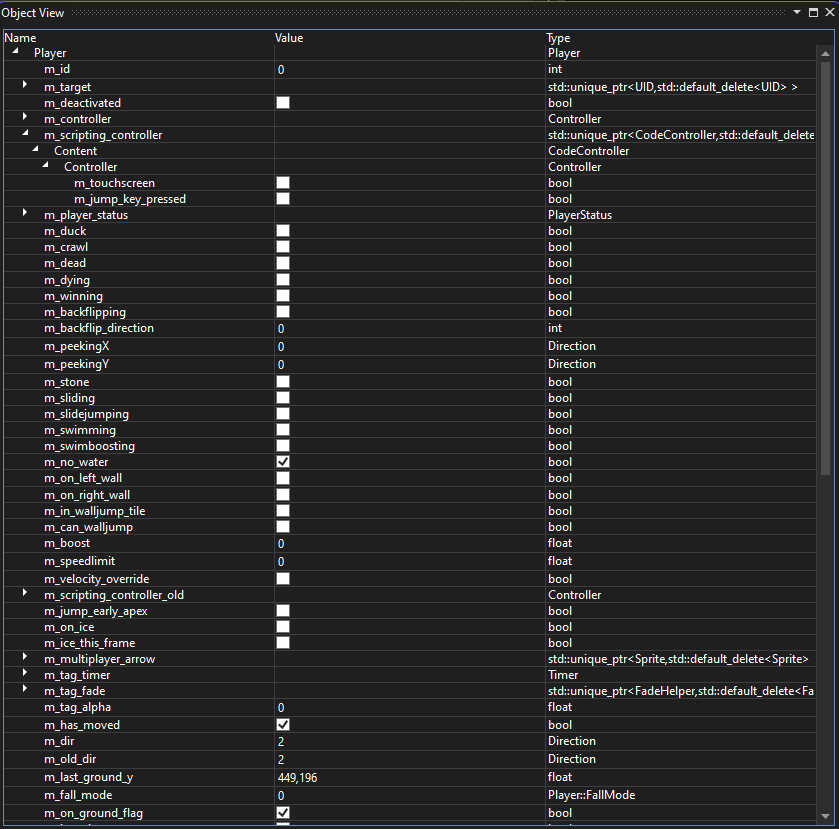
View and alter any object live
Browse & alter objects at runtime by inserting a snippet with the view command.
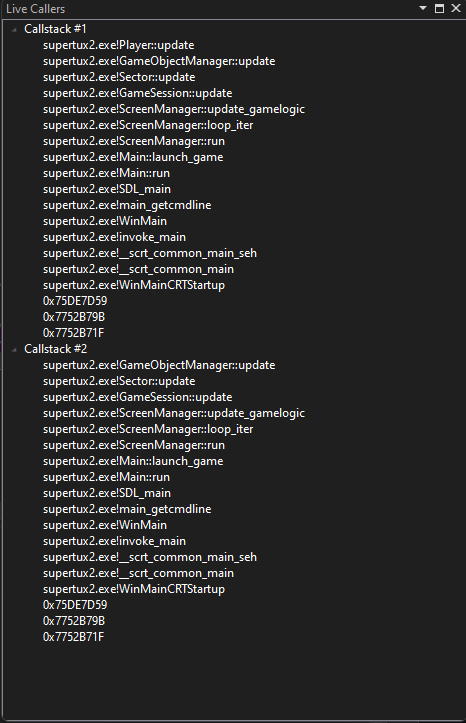
View calling functions live
Track the call stack of a particular function live without setting any breakpoints. Simply place the cursor anywhere in the function to track new call stacks.
Supported platforms
- D0 works entirely by analyzing data from PDB files your compiler generates.
- Supported compilers include Visual Studio (MSVC) and clang.
- Works with debug and release builds on 32 and 64-bit architectures.
- Profiling Live++ recompiled code requires additional setup: view instructions.
Free Trial
$0
-
All features
- 30 days trial
- No credit card or login required
All features
€39.99
-
Live Profiler
- Perpetual license
- Per-seat
- Future updates
Step predictions
Active line visualization
Inline variable changes
Live callstack
Live scripting